TIME
It’s been an interesting week, with lots to think about. However it’s not been a massive success in terms of my goals.
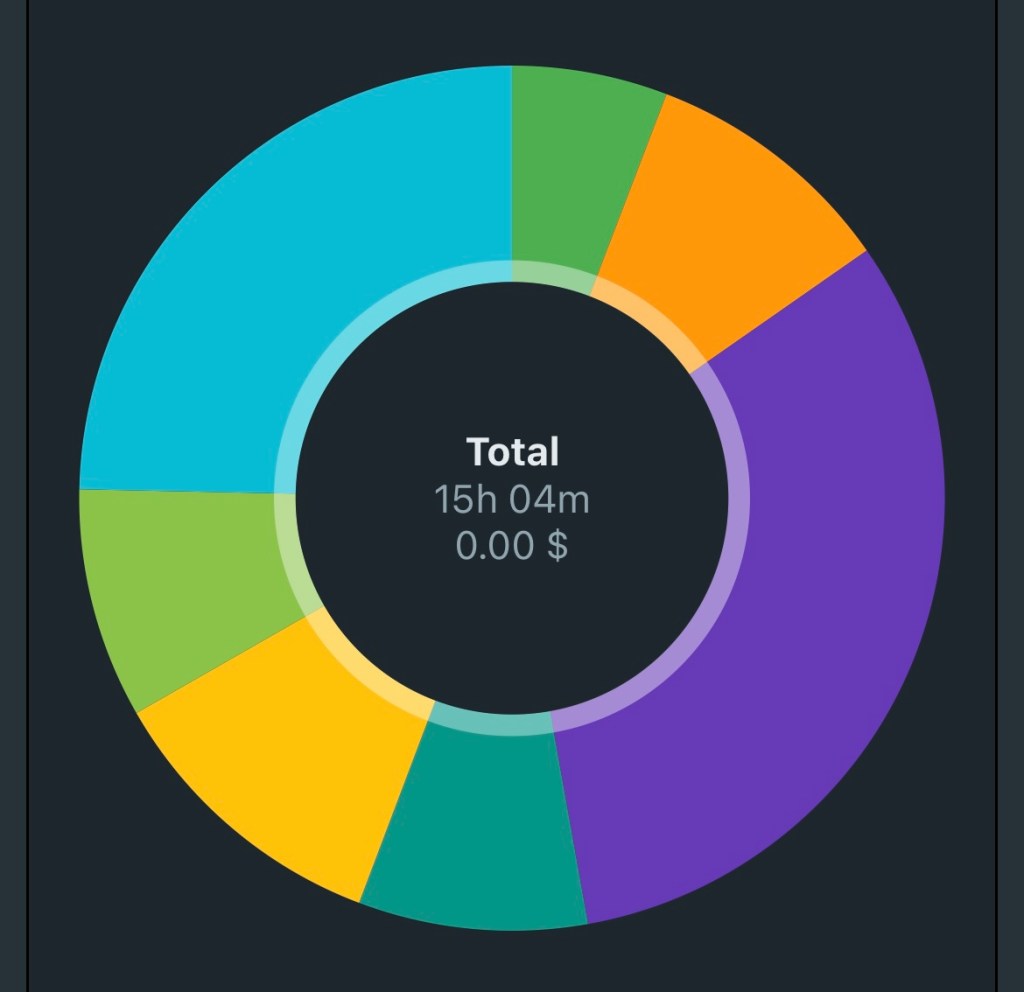
First of all my time goal of 25 + hours, I didn’t manage that. More like 15 or so. Some of that is down to the weather preventing me from getting out to make work, but honestly I need to do a bit better as regards that. It felt like a fairly light week though, compared to last week. One upside though: the purple bit is closer to half the time spent working on my own work. I.e. making images. So that’s good. That means spending longer on the making work bit will get me closer to my goals anyway.
And I can always spend longer on independent research as well.
ENERGY
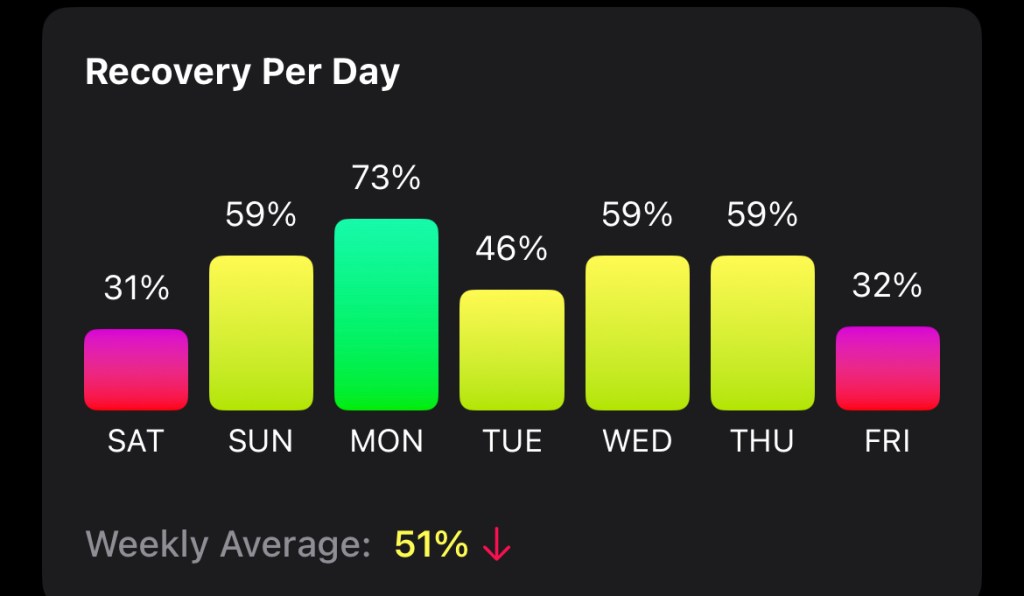
Not sure what to make of this, except to say the red bars definitely represent accurately my bad days. I think I’ve been fighting something off, but it wouldn’t surprise me to see this repeated weekly. Bookended by bad days on Friday and Saturday, recovering through Sunday and then bouncing along until I hit the red again the next Friday.
What it emphasises is the need for recovery especially at weekends. I did push myself a bit too hard in order to make work yesterday, so that might also be a factor. I was frustrated by the weather in particular ( stormy yet again today as well) and was determined to get out while I could.
Anyway. I suspect this will be the pattern. I’ll push when I can, pull back if I have to.
Onwards!
